On the 2019 International Day of the Girl, the Valley Female Leadership Network (VFLN), in Nova Scotia’s Annapolis Valley, posted an infographic on the status of girls and women’s participation and leadership in sport and recreation. The infographic was shared across the country, but most importantly used by the VFLN and their stakeholders as a tool to increase support for female-only programming in the Valley. This blog is the story of our infographic.
The need for the infographic
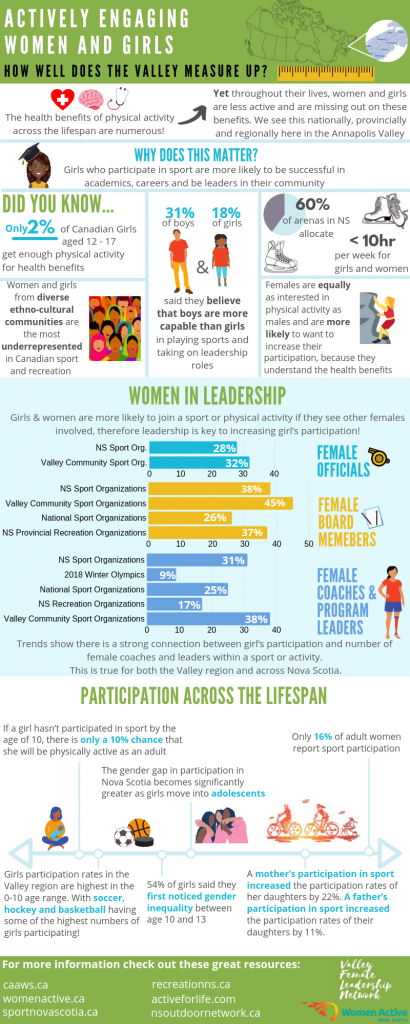
In many communities and amongst many sport and recreation organizations, female-only programming and leadership development opportunities are common; and the situation in the Valley is no different. Female-only programming is designed to address inequities in the participation and leadership of girls and women in sport and physical activity (Canadian Women & Sport, 2012). However, we continued to hear questions from parents, administrators, community members and decision makers such as “Why do girls and women need special programs?” and “What about the boys?”
We would reply, sharing the research and anecdotal stories, but some people remained skeptical. They didn’t understand the social and systemic barriers women and girls confront to participation and leadership, hadn’t experienced girls’ reluctance to try a new sport. And sometimes we didn’t feel we had access to strong enough evidence that reflected the experiences of girls and women locally, or in our region or province. We realized we needed a tool to help share the evidence and the need for action – something that was quick, compelling and easy to disseminate. An infographic would be perfect.
Refining the content
According to the Marriam-Webster Dictionary, an infographic uses graphic elements to present information in a visually striking way. Girls and women’ involvement in sport and physical activity is a very broad topic – the amount of information can be overwhelming. We knew it was important to clarify from the beginning the purpose of our infographic, then collect and select the best data for this purpose. So what information should we include?
For us, the content was driven by three considerations:
- Reflecting participation across the lifespan, knowing the positive influence of early sport and physical activity experiences.
- Capturing women’s leadership in the broad sport and recreation sector. While the available data was primarily from sport, we believe there is a strong correlation between leadership in sport and in recreation.
- Presenting local data to ensure the infographic was clear about the need for local action. With national or even provincial data, people can explain away the trends, or maintain their belief that the challenges don’t happen in their community.
With those considerations in mind, we sourced local, provincial and national statistics from a range of reliable sources, including the Nova Scotia Arena Access Study, Women Active Nova Scotia, Canadian Women & Sport, Sport Nova Scotia, Recreation Nova Scotia, and the provincial government.
The women in leadership bar graph packs in a lot of information and perspective into a concise display.
~Active Communities and Recreation Coordinator
Developing the infographic
The development of the infographic was a partnership between VFLN and Women Active Nova Scotia. A co-op student working for Women Active Nova Scotia in the spring of 2019 provided the research support required. Investing time to create a meaningful resource that would have a lasting impact as well as be informative and valuable for our community stakeholders was a priority for this project. Having someone dedicated to the project, rather than an existing staff person doing it off the corner of their desk, was key to success. We used Canva as a tool to help turn our ideas and statistics into a compelling infographic.
Timing and Dissemination
VFLN wanted to be strategic about launching this resource. Although it was ready for distribution in the summer, we wanted to connect the launch to an established day that celebrates women and girls to take advantage of the hype, discussion and connection to recognizing the need to support girls and women. We chose International Day of the Girl on October 11th. On social media, our initial post had more than 5,000 impressions – not bad for a small committee! However, we know the infographic was picked up by several other organizations and redistributed, greatly expanding the reach.
VFLN also broke down the infographic into its three sections and posted it leading up to International Women’s Day 2020 – another great opportunity to share the evidence and amplify our message in conjunction with a celebration of women and girls. Focusing on each section to bring awareness and create that impact of what is happening in the Annapolis Valley.
Infographic impact

The infographic is a resource that our partners can take to meetings or submit as a background and education tool when talking about opportunities for women and girls within sport, physical activity and recreation – whether it is municipal government reporting to council, or for community or provincial sport organization board members. The response has been overwhelmingly positive, and other regions in the province are now looking to create a similar tool that reflects their region and communities. Municipal Recreation Departments are utilizing the infographic as a tool to share with their community stakeholders, and we plan to use the infographic to help engage and educate school administrators.
“The infographic provided concrete LOCAL evidence why we need more funding and programs to foster female participation, engagement and leadership. It also supports intergenerational female programs”.
~Community Recreation Coordinator
Long term, we hope through this tool we will impact and influence decision makers, which will in turn influence policy development in various sport and recreation programs and services. This will generate a positive, supportive, and welcoming environment for women and girls to be active and get involved as leaders in our communities.
Tips for creating your own infographic
Our infographic was about gender equity, but our approach could be used to create a tool to support and influence any kind of change you want to see in your community. In addition to our insights above, our advice is:
- Don’t be afraid to jump in and get started in creating an infographic.
- Develop a good sense of the core information first, to avoid getting lost in the visuals.
- You may find you have too much information but that’s okay – you can always create another infographic!
About the Valley Female Leadership Network
The Valley Female Leadership Network’s mission is to engage with stakeholders to build capacity and create supportive environments for girls and women within the Valley region through networking, training, recognition, and program support. Our Vision is that girls and women are participating in, leading and influencing physical activity, sport & recreation in our communities. Valley Female Leadership Network has focused their time on three priorities: developing leadership, communication and celebration. For more information, follow VFLN on Facebook and Instagram.