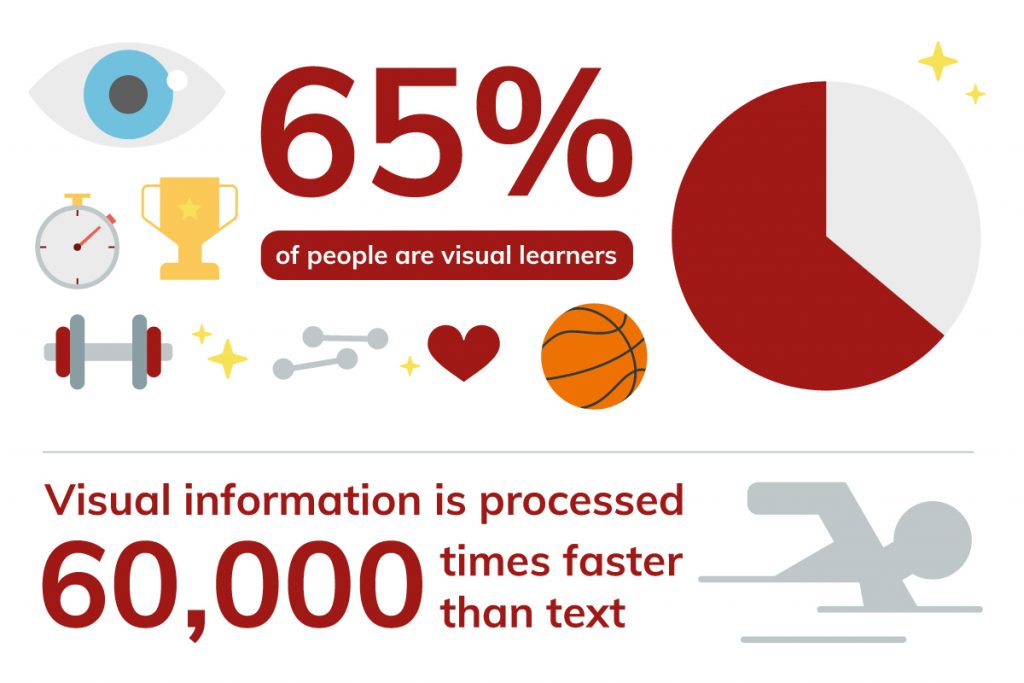
When you have a message to share, the first question that comes to mind is ‘How do I present this to make it memorable?’ According to social science research 65% of people are visual learners and visual information is processed 60,000 times faster than text. This means that most people will be more attracted and more likely to retain information if it presented with some sort of visual component like a photo, graphic or video. So it makes sense that in order to communicate our messages in sport effectively we should be taking advantage of visual components of design in coordination with the text/information we are trying to share. In this context more and more people are using infographics to take advantage of a mixed style of learning. The following are some simple things we should keep in mind when we embark on creating infographics.
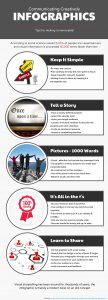
Keep it Simple
- Be clear and concise.
- Plan carefully to keep the main point as the focus.
- Keep it specific, relevant and targeted.
- Make it easy to share by keeping it a manageable size. If it has to be resized, then its readability may be lost (600 pixels wide is recommended). If it is too long, you’ll lose people (length no more than 8,000 pixels). If the file size is too big it inhibits sharing (no more than 1.5MB).
Tell a story
- Have a clearly defined purpose.
- It is not the time to assemble all the information/data you know on a topic, select the specific point you are trying to make.
- Know who your target audience is.
- Create a knockout headline (70 characters is a good length) that will both describe the purpose and catch audience attention.
- Use information that will evoke an emotional response in your audience.
- Answer a compelling question.
- Make sure there is a flow to your infographic both visually and cognitively.
A picture is worth a thousand words
- It must be visual to be effective but the visual must convey the message and the key information.
- Your graphic’s primary purpose is to make your data comprehensible to a wide audience.
- Be creative, but be careful not to complicate the story with complex images.
- Make sure the images reflect your organization’s brand or style.
- Use white space to drive the visual story.
- Have a good balance between visual and text/information.
It’s all in the numbers
- Do your research, data is powerful.
- Use numbers to convey key points and to evoke a response.
- Fact-check to make sure your numbers are reliable and credible.
- Cite any sources used or provide a link.
- Use sources that are timely and up-to-date as possible.
Learn to Share
- Format the graphics to fit social media.
- Keep it short or design a series of posts if the information longer.
- Promote your infographic by reaching out to your network.
- Include an action that you wish the audience to take.
- Invite your audience to share.
- Invite comments and feedback.
Visual storytelling has been around for thousands of years, the infographic is merely a modern twist on an old concept. By following some simple steps and combining the use of visual flow with data presentation we can effectively convey a message that is both pleasing to the eye and informative and memorable for the audience.
References
10 steps to creating the perfect infographic. Creative Bloq. March 2014. Retrieved from the Internet October 3, 2016.
12 Infographic Tips That You Wish You Knew Years Ago. Retrieved from the Internet October 3, 2016.
How to create effective infographics. Yeomans Marketing and Fundraising Specialists. Retrieved from the Internet October 3, 2016.