In 2017, The Economist boldly published that data, not oil, was the world’s most valuable resource (Parkins, 2017). Sport organizations produce more data than most organizations, ranging from athlete training and performance tracking to business-related information, such as memberships and participation data (Hayduk, 2020). National and provincial/territorial sport organizations (NSOs and PTSOs) are producing and collecting data on many aspects of their operations, but often underusing these longitudinal data sets. These organizations also face extremely complex decision-making environments, with member organizations varying drastically in terms of location, resources, capacity and served populations (Fried and Mumcu, 2016).
In this blog, we make the case for data-driven decision-making in sport organizations and share our experience with implementation. Specifically, we discuss how a partnership between Brock University and Row Ontario, supported in part through a SIRC Researcher/Practitioner Match Grant, leveraged participation data to support decision-making at Row Ontario
Our goal is to highlight how existing data, when looked at differently, might help sport organizations navigate complex decision-making processes, particularly at the provincial and national level.
Complex decisions in sport
Competing objectives complicate the work of NSOs and PTSOs. On one hand, they’re trying to increase participation as much as possible in their respective sports. Sport policy and public opinion suggest that broad-based sport participation is an important contributor to health and well-being, community development, national pride and social cohesion (Thibault & Harvey, 2013). On the other hand, NSOs and PTSOs oversee elite development systems, or the processes through which they identify top athletes, those who’ll be nurtured and, ultimately, will flourish as national or international competitors.
 Although these 2 objectives might seem complementary, striking a balance isn’t easy. Too much focus at the community level can mean organizations risk their most competitive athletes feeling unsupported. But too much emphasis on elite programs may threaten whether organizations have solid feeder systems at the community level from which to recruit athletes. In policy terms, these issues are called “wicked problems” because there’s no clear solution and often “solutions” lead to more problems (Sam, 2009).
A tendency to rely on tried-and-true sport development practices and to have ex-athletes work in the sport system also complicates these issues. Although these practices have the potential to be effective, they risk creating stale organizations that rely on “how it’s always been done” instead of thinking creatively about how to mix things up, reach new populations, and “do sport differently.”
A foray into data-driven decision-making
So, what’s a decision-maker to do? In 2020, Row Ontario led a project to explore how data could be used to better inform organizational decision-making. Research is often (mis)construed as time-consuming, resource intensive, and requiring specialized skills to develop tools and collect and analyze data. In partnership with Brock University, Row Ontario simplified this process by using existing data (participant information) to better understand rowing participation province-wide.
Specifically, we aimed to understand sport participation patterns in terms of gender and space (that is, where participants were located in the province). The intention wasn’t to set the stage for any particular changes or major development, but rather to better understand how existing data could inform future action relating to sport participation.
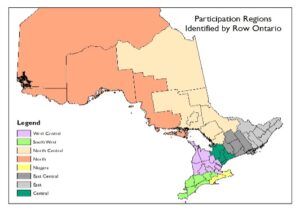
The participation data set included 6 years of participation data, from 2014 to 2015 and 2019 to 2020. We organized it by regions or census divisions. Then, we analyzed participant demographics within these regions to help think about sport participation and policy decisions moving forward.
What the data showed
While the total number of clubs and participants, registered province-wide with Row Ontario, fluctuated, the trend was stable. For example, the numbers fluctuated in the same way in terms of gender. However, the analysis revealed interesting regional differences.
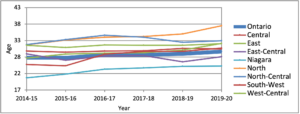
Average ages within the regions ranged from 20.9 years (Niagara, 2014 to 2015) to 37.5 years (North, 2019 to 2020). Of note, the average age of participants increased across the 6 seasons in all but 1 region (West Central). While not necessarily groundbreaking findings, visualizing the data (see Figure 3) showed how pronounced the trends were, and provided a platform for data-driven discussions about participation.
Read the full report on the findings of this project. Or, view a summary of the findings in this 15‑minute video presentation:
What we learned
Data-driven insights are important as they can both confirm needs as well as monitor and evaluate existing programs and initiatives. Here are 2 ways our data analysis could inform or support decision-making at Row Ontario.
 First, with regional differences in mean ages, Row Ontario could explore more strategic ways to grow the sport or develop a sustainable pool of participants. In Niagara, where there’s a large pool of young participants, we might focus on retaining athletes from development programs to increase adult or recreational participation. Northern region participants are generally much older, so there we might focus on increasing awareness and first contact opportunities for young people.
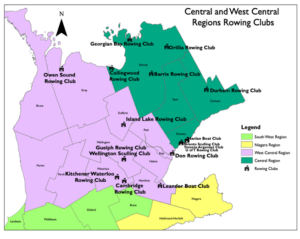
Second, by necessity rowing clubs are found near flat water and require specialized equipment. Since access to both equipment and facilities is restrictive, that access limits entry to the sport. By contrast, participation in coastal rowing is growing as its water conditions aren’t as restrictive. Coastal rowing has been on the radar of Row Ontario for some time. And, after seeing the visualizations and clustering of participants in certain areas, it’s clearer how coastal rowing can serve specific regions and become a way to reach new people in new places.
It’s as easy as 1, 2, 3
Data-driven decision-making doesn’t need to involve complicated data collection and analysis. It can, but it doesn’t have to. We offer these 3 pointers to make working with data easier:
- Data inventory: Know what data you already have and how to access it. This can be as easy as pulling old records, exporting files or speaking to people in your organization to collect their opinions (knowledge is data too).
- Develop your questions: Figure out what you want to learn from the data. You might consider changes over time (for example, different seasons) or space (such as, different regions), or evaluate a specific program or initiative.
- Let the data tell the story: Don’t start with an answer in mind. Instead, be ready for answers you didn’t expect. Looking at all the data in this way will provide a more robust understanding of what it can tell you.